
USA Public Transit Data Analytics
Project Overview 📊
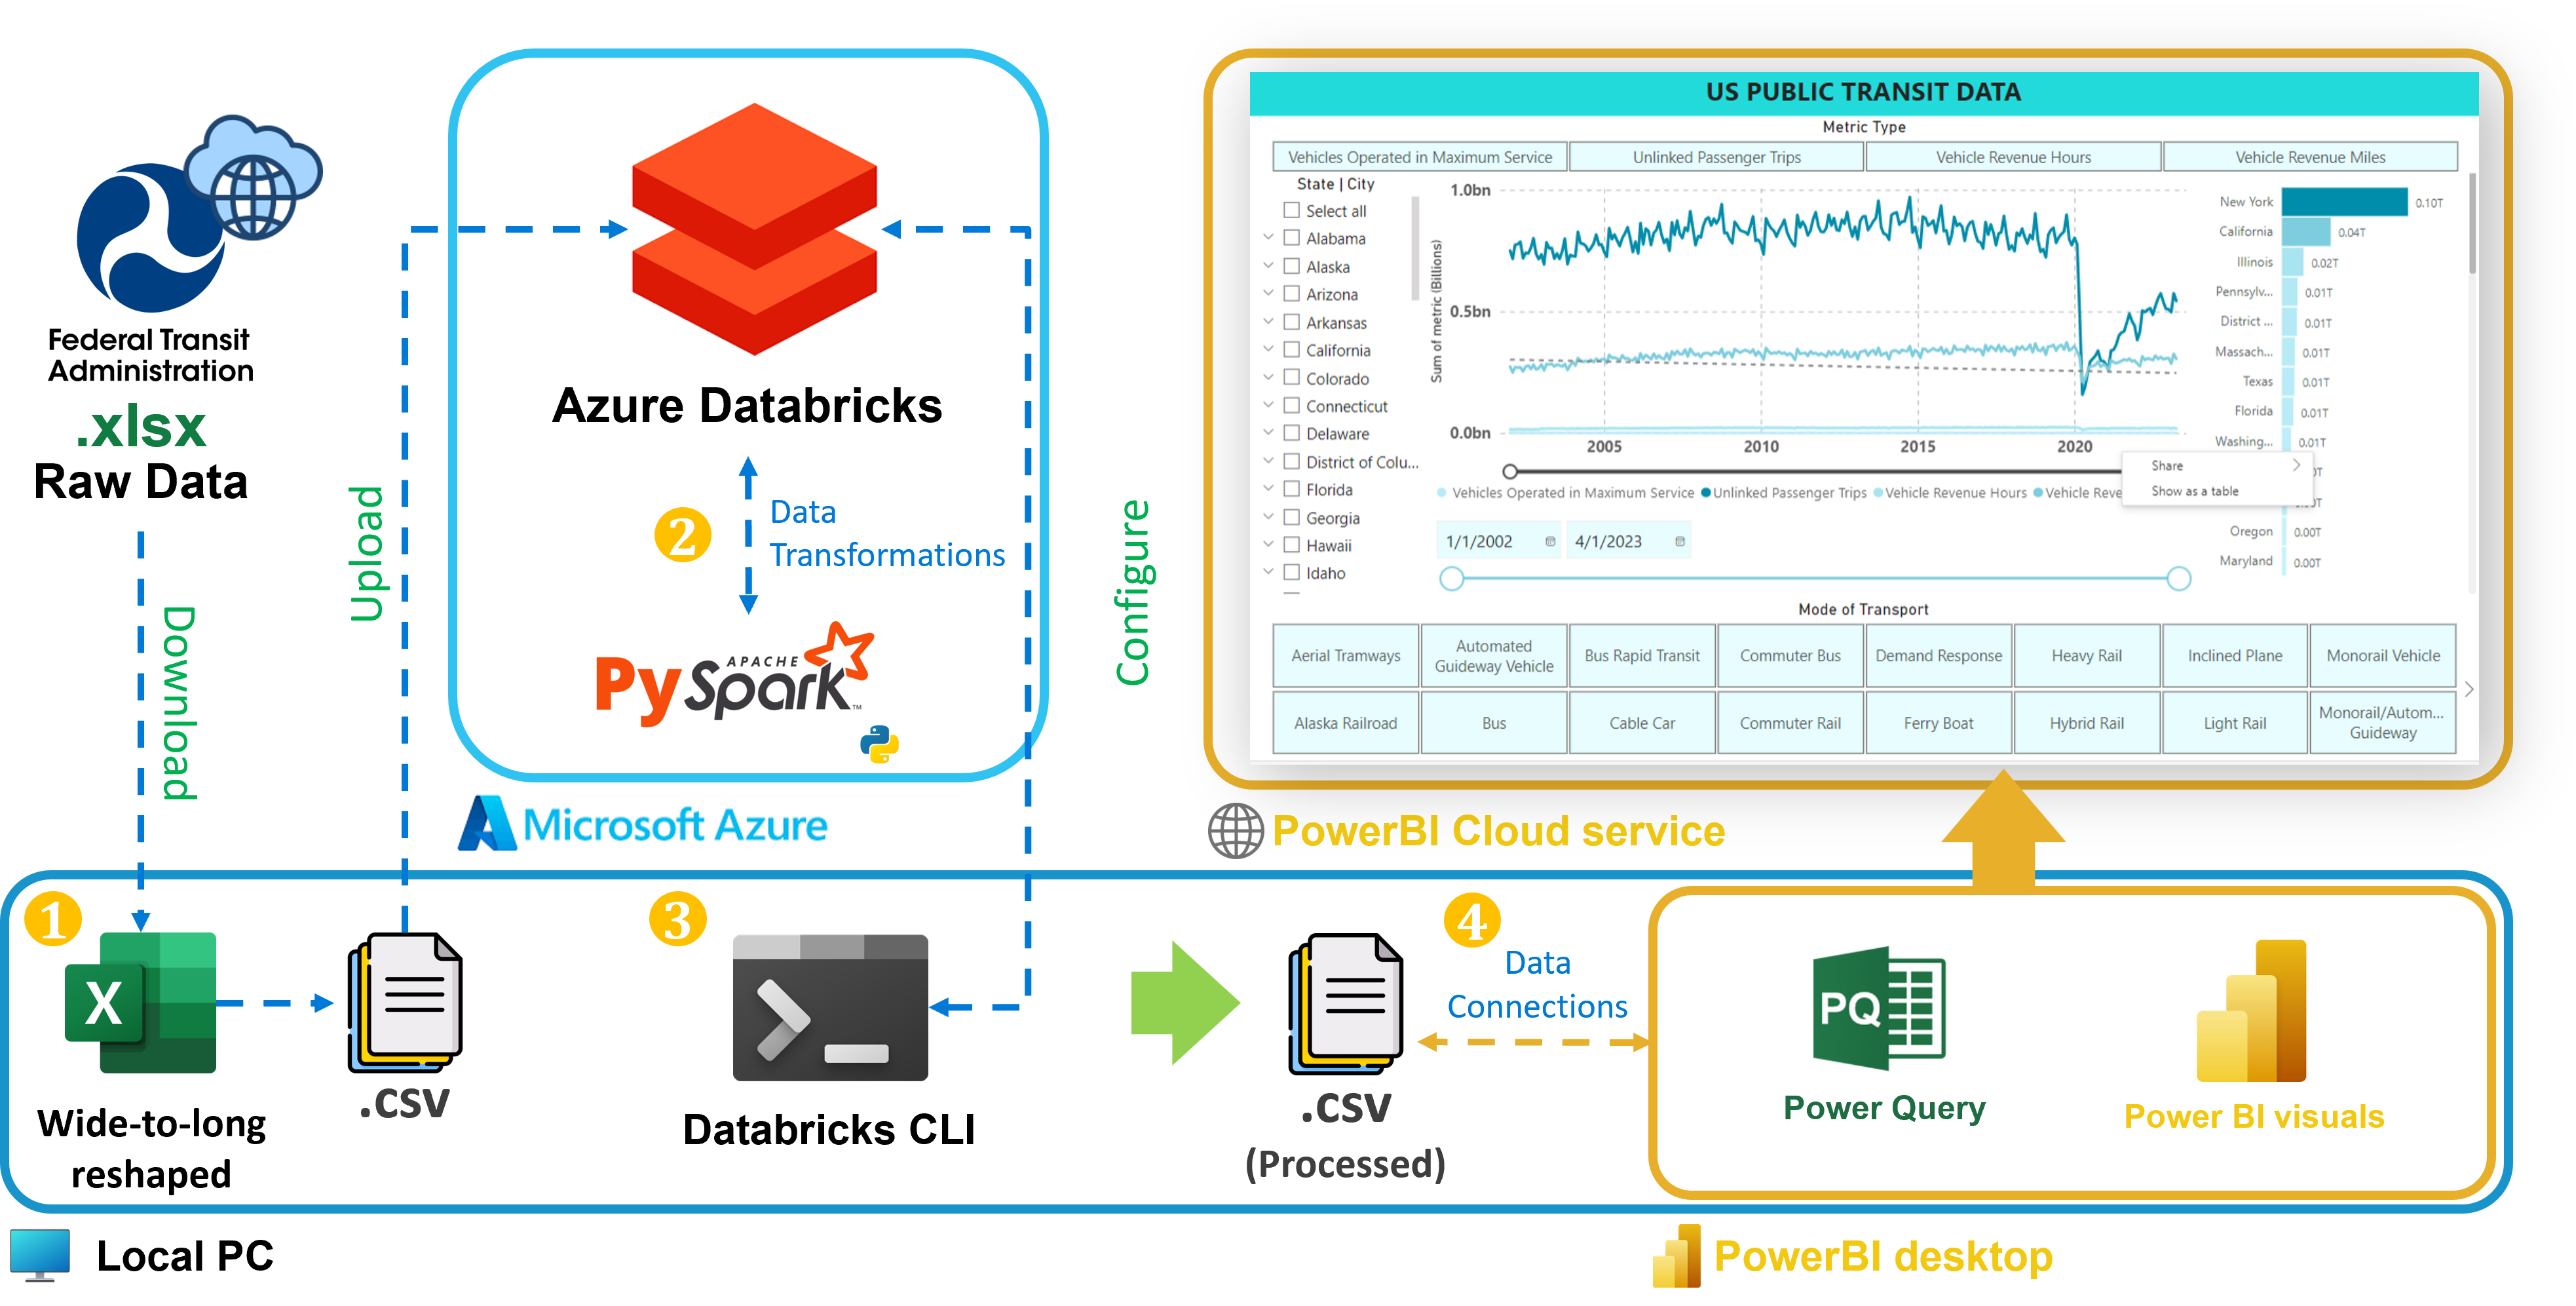
This project presents an interactive Power BI visual report built from the National Transit Dataset (NTD), a comprehensive data source from the U.S. Federal Transit Administration (FTA). It tracks monthly ridership trends, vehicle revenue miles, and performance metrics across various public transit systems. The goal is to provide stakeholders, policymakers, and researchers with data-driven insights on regional usage patterns, the impact of events like COVID-19, and mode-specific operational performance.
Tools & Technologies 🛠
- Microsoft Power BI – For interactive report design and data visualization.
- Azure Databricks – Used for large-scale data preprocessing and transformation.
- Microsoft Excel – Employed for supplemental data cleanup and integration.
Live Demo 🔗
You can interact with the live report below:
Acknowledgement ✅
This project is a part of ATS’s projects catalog, and has been developed in collaboration with my colleague, Abdur Rehman.